Five tasks. Five days each. A five-person team, one task per person.
On paper, the project takes five days. In practice, it lands on day twelve, and nobody working on it did anything wrong.
Those seven extra days didn’t come from a blown estimate or a slow team member. They were built into the schedule from the start, sitting inside two things most project plans never name properly: lead time and lag time. Get them confused, and a schedule that looks perfectly logical on a Gantt chart quietly drifts weeks past where it should have landed.
Two Delays Wearing the Same Name
Here’s where most explanations of this topic go wrong: they define lead time as “how long a task takes.” That’s not lead time in a schedule. That’s just task duration.
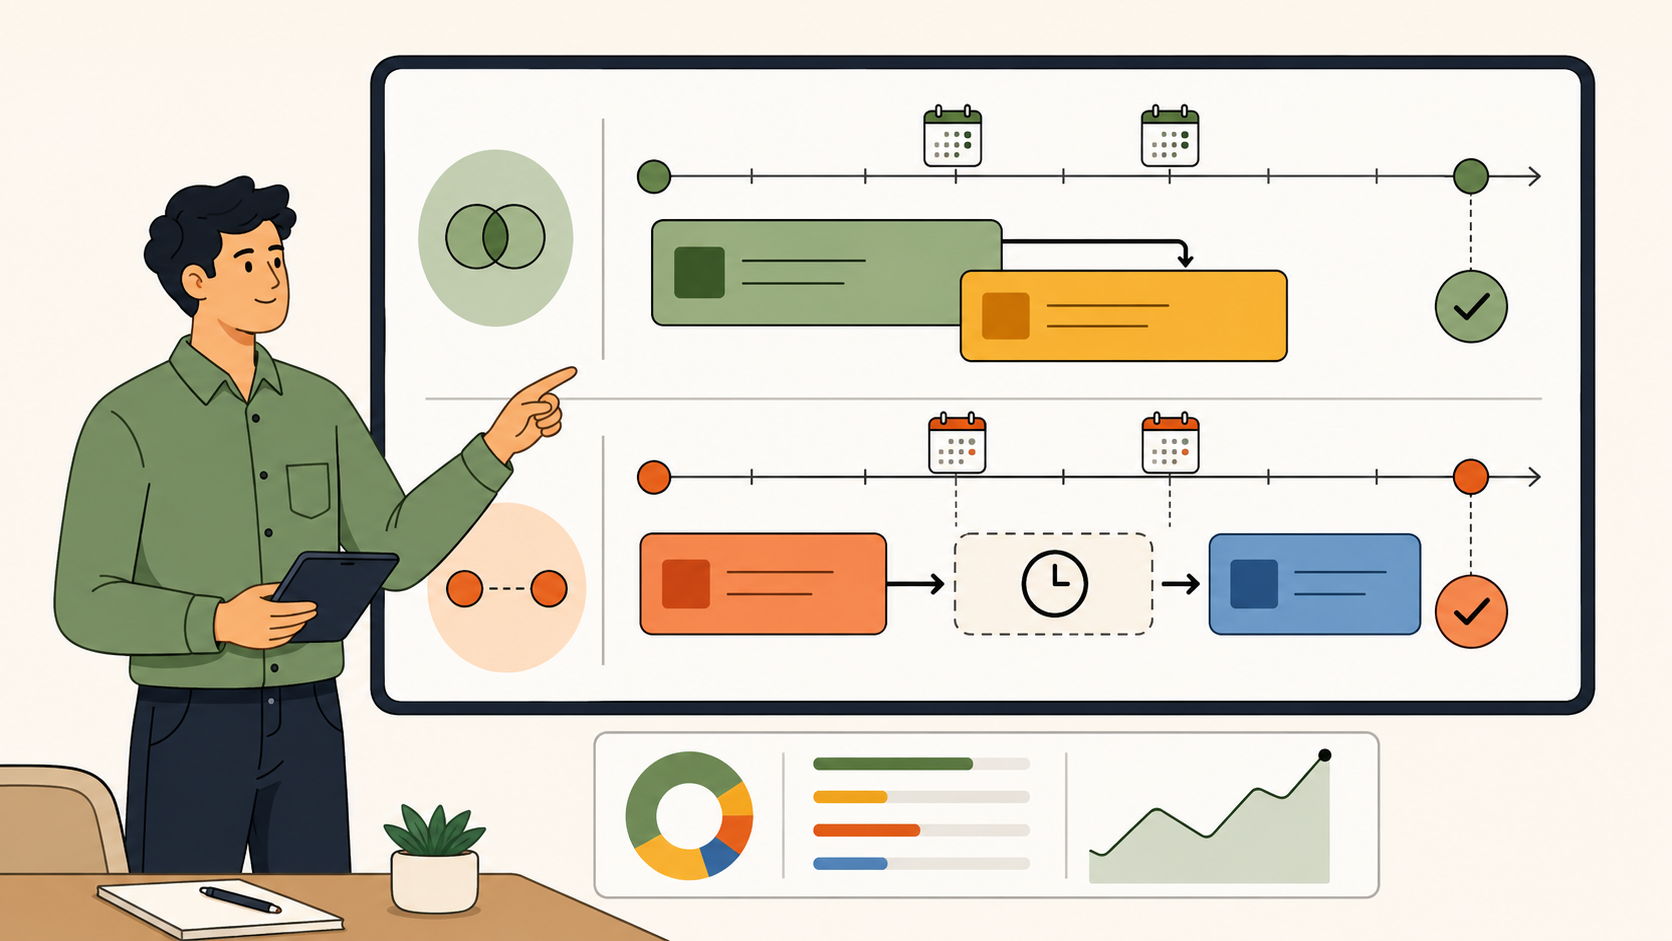
In project scheduling, lead time is the overlap you deliberately build in so a successor task can start before its predecessor finishes. If design review usually needs the full brief signed off, but you let the developer start environment setup two days early because that part doesn’t depend on the brief, you’ve given that task two days of lead. Most scheduling tools enter this as a negative value against the dependency, because it’s compressing the timeline, not extending it.
Lag time runs the other way. It’s the enforced wait between a predecessor finishing and a successor starting. Concrete has to cure before you build on it. A client has to sign off before development starts.
That wait is lag, and it’s not a flaw in the plan. A schedule with zero lag anywhere is usually a schedule that hasn’t accounted for real dependencies at all.
There’s a third term worth separating out here, because it gets tangled into the same conversation constantly: leading and lagging indicators. Those come from KPI and OKR frameworks, not scheduling. A leading indicator predicts an outcome before it happens (proposals sent this week); a lagging indicator confirms it after the fact (revenue closed last quarter).
It has nothing to do with task overlap or delay, but the shared vocabulary means teams routinely talk past each other in the same planning meeting. And if you’re mapping workflow timing more broadly, cycle time and flow efficiency measure something different again: how long a task actually sits in progress once work begins, not the overlap or wait built around it.
| Term | What it actually measures | Where you’ll see it |
| Lead time (scheduling) | Overlap allowed between a predecessor and successor task | Gantt charts, dependency fields, critical path calculations |
| Lag time (scheduling) | Enforced wait between a predecessor finishing and a successor starting | Gantt charts, dependency fields, buffer planning |
| Lead time (supply chain) | Total duration of a task or order from start to finish | Manufacturing, procurement, fulfilment reporting |
| Leading / lagging indicators | Predictive vs. confirmed business metrics | KPI dashboards, OKR reviews, sales and revenue reporting |
Four terms, three completely different jobs, one shared vocabulary. Sort that out first, and the rest of this gets a lot easier to act on.
What Lag Time Actually Costs You
Say your delivery process runs design, then client sign-off, then development. The sign-off step regularly takes three or four days across a handful of concurrent client engagements. That’s not one delay. It’s lag, and it’s completely normal to plan for it.
What’s not normal is what happens to the designer during those three or four days. If nothing else is scheduled against them, that’s not a pause, it’s bench time: hours that show up on a timesheet as logged but not billable, or worse, not logged at all because there’s nothing obvious to attach them to. Multiply that across five or six client projects running the same lag pattern every month, and you’re not looking at a handful of quiet afternoons. You’re looking at fifteen to twenty days of unplanned capacity a month, sitting invisible until someone finally asks why utilisation dropped.
💡 Pro Tip: Treat known lag windows as schedulable capacity, not dead time. If sign-off reliably takes three days, that’s three days to deliberately assign a different billable task to the same person, not three days to hope nothing goes wrong.
The fix isn’t eliminating lag. Some of it is unavoidable and some of it is genuinely protective, giving a team room to breathe between handoffs instead of running everything back to back. The fix is knowing which lag windows repeat, and planning something billable into them instead of letting them sit empty. That’s the utilisation patterns worth watching, and it’s exactly the kind of signal that gets lost when resourcing decisions are made project by project instead of across the whole team’s capacity.
What Compressing Lead Time Actually Costs You
Lead time has the opposite problem. It looks like a win right up until it isn’t one.
Picture a developer starting build work two days before the brief is formally signed off, because the client relationship is solid and everyone’s confident nothing major will change. Most of the time, that confidence is earned and the two days genuinely save the project time. Occasionally, the client comes back with a change that touches exactly the part already built.
Now there’s rework, and rework rarely shows up as a clean line item. It shows up as actual effort quietly overtaking allocated effort on that task, and as hours that don’t map cleanly to anything billable, because reworking something already built isn’t the same conversation as building it the first time.
💡 Pro Tip: Only compress lead time on tasks where the upstream deliverable is genuinely stable, not just probably fine. If a brief has changed twice already, that’s not a candidate for early starts.
This is the same non-billable creep that shows up in scope drift, just triggered from the opposite direction. Scope drift usually gets framed as the client asking for more. Lead time compression is the team giving more before it’s confirmed to be needed, and the financial signature on the timesheet looks almost identical either way: hours that don’t reconcile against what was actually signed off.
Building Both Into the Schedule Before They Cost You
Most of this is manageable the moment lead and lag stop living in someone’s head and start living in the schedule itself.
In Skarya, this is what the Dependencies tab on a task is built for: it shows the full relationship between a task and what it’s waiting on or overlapping with, alongside status, priority, assignee, and dates, all in one table instead of scattered across separate conversations. The Timeline view then lets you see those overlaps and gaps visually across a whole board, which is a far faster way to spot an unplanned three-day gap than reading it off a list. Pair that with Allocated Effort set at the task level, and you’ve got a plan that accounts for lead and lag on purpose, rather than discovering both after the fact.
💡 Pro Tip: When you set up a new dependency, ask which direction it should move before you touch the number. Overlap (lead) speeds things up but adds risk. Delay (lag) protects quality but costs capacity. Neither is automatically the right call, but guessing is always the wrong one.
None of this replaces the eight-step build we walk through separately for putting a full schedule together. It’s the layer that sits underneath it, the part that decides whether the schedule you build actually survives contact with real dependencies.
Catching Drift Before the Invoice Does
The earliest warning sign that lead or lag has gone wrong isn’t a client complaint. It’s the gap between Allocated Effort and Actual Effort on a task, and it shows up long before anyone notices the project’s running late.
If a task’s actual hours are consistently running ahead of what was allocated, and the pattern clusters around tasks that started early or followed a compressed dependency, that’s lead time compression turning into rework, caught while it’s still one task instead of a project-wide blowout. If bench time keeps appearing on the same handful of engagements during the same handoff points, that’s lag time that was never planned for, sitting there every single cycle.
💡 Pro Tip: Review Allocated vs. Actual Effort weekly, not monthly. By the time a monthly report flags it, the pattern’s already repeated three or four times across active projects.
Neither of these needs a new report to catch. They need someone actually looking at the fields that already exist, at a cadence tight enough to matter.
The Real Takeaway
A schedule isn’t just a list of dates. It’s a set of decisions about where you’ve deliberately built in overlap, where you’ve deliberately built in wait, and where you’ve done neither and are simply hoping it works out. Once you start reading a Gantt chart that way, a “five-day” project landing on day twelve stops being a mystery. It’s just lead and lag, doing exactly what they were always going to do, whether anyone planned for them or not.