You can run an agency for two years before you notice something uncomfortable. The clients you love working with most are often the ones losing you money. The team looks busy. The invoices go out. The bank account climbs and then mysteriously slides back down. Nowhere on your screen is a single number that tells you whether any of this is actually working.
That gap is what KPIs for agencies are supposed to close. Most beginner guides treat them as a vanity exercise: pick a dozen, stick them on a dashboard, present them in a quarterly board pack. That isn’t what they’re for. The real job of an agency KPI is to catch a problem on a Tuesday in March, not to look impressive in October.
Here are eight to start with, why each one matters, and how to calculate it without a finance degree.
What a KPI actually means for an agency
A KPI is a number you’ve decided is worth defending. Not just measuring. Defending. If your gross margin is supposed to be 40% and it slips to 28%, that’s a number you act on, not one you note down. Every KPI on this list passes the same test. If it moves the wrong way, you can’t ignore it for long without something breaking somewhere expensive.
Peter Drucker put the underlying principle bluntly: “What gets measured gets managed.” For an agency, the more painful inverse is the one to remember. What you don’t measure quietly eats your margin until you wonder where the year went.
Start with profitability. Nothing else matters if the maths underneath is wrong.
Profitability KPIs: the ones that decide if you stay in business
These three tell you whether the work you’re doing is a business or an expensive hobby with clients.
1. Client gross margin
The single most useful number in your agency. It tells you how much profit each client is actually generating after you account for the cost of the people delivering their work.
Formula: (Revenue earned from client − Cost of delivery) ÷ Revenue earned from client × 100
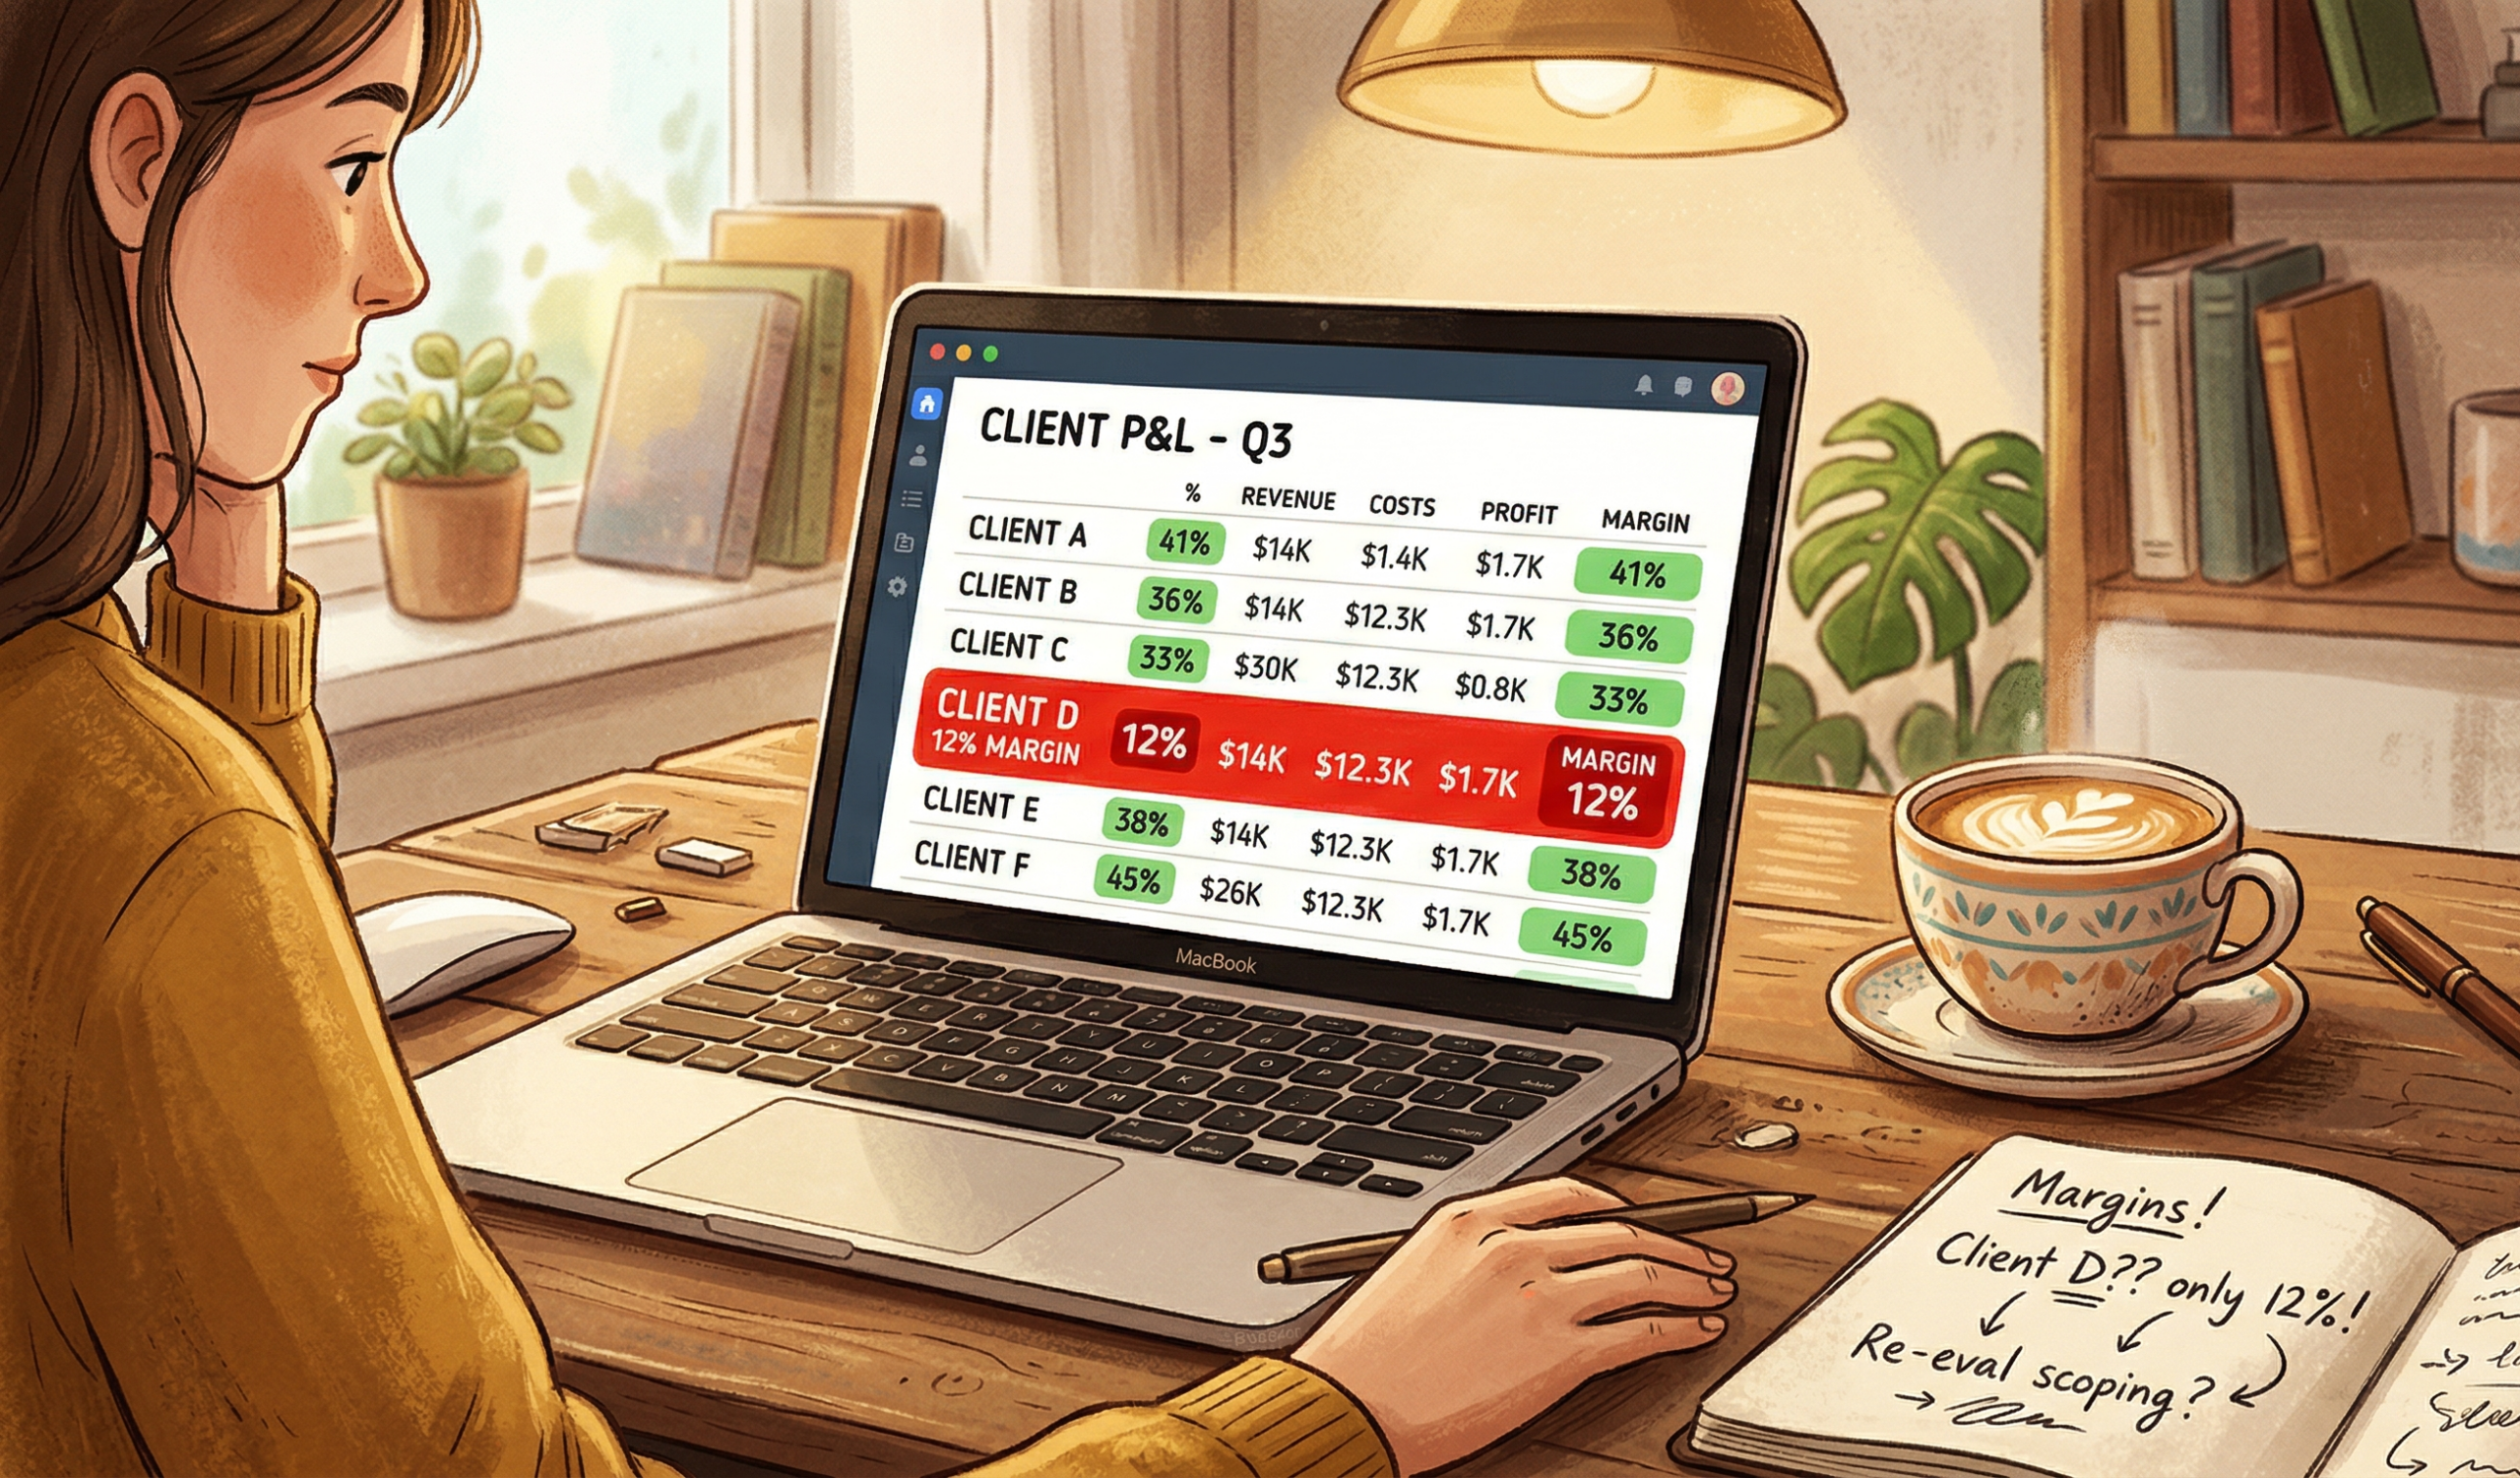
Picture a 14-person agency with a flagship client on an $8,000 monthly retainer. Feels great. But the lead designer, two developers, and an account manager spend roughly 90 hours a month on that account. At blended rates that’s around $7,200 in delivery cost. Margin: 10%. You’re one sick week away from breakeven on your “best” client.
💡 Pro Tip: Calculate this monthly per client, not quarterly across the whole agency. Quarterly averages hide the one or two clients dragging the studio down.
2. Effective hourly rate
Your contract might say $150 an hour. The number that matters is what you actually earned per hour the team actually worked. These are rarely the same thing.
Formula: Revenue earned from client ÷ Total hours worked on that client
The gap between the two is where scope creep lives. Effective hourly rate is the metric that catches it before the project post-mortem.
3. Revenue backlog
This one barely shows up in most agency KPI guides, and it’s the one that keeps senior owners up at night. Backlog is the value of work you’ve contracted for but haven’t yet delivered.
Formula: Signed revenue − Earned revenue
If you’ve signed $400K in contracts this quarter and only delivered $260K of work, you’re sitting on $140K of backlog. That’s not a brag. It’s a delivery bill you owe. Backlog climbing faster than capacity is the early warning sign of a year-end resourcing crisis.
Delivery and capacity KPIs: your early warning system
The next three tell you whether the team is built to actually fulfil what the profitability numbers assume.
4. Billable utilisation rate
The percentage of your team’s available hours that go to billable client work. Most beginner guides tell you to push it as high as possible. They’re wrong.
Formula: Billable hours ÷ Total available hours × 100
Healthy creative and consulting agencies usually sit between 65% and 80%. Above that and you have no slack for sales, training, or the small share of every project nobody can predict. Below 60%, you’re either underpriced or under-sold.
5. Estimate accuracy
Compare the hours you planned for a project against the hours it actually took. If you’re consistently 25% over, your scoping process is broken, and every margin calculation built on those scopes is fiction.
Formula: Actual hours ÷ Planned hours × 100
💡 Pro Tip: Track this as a rolling three-month figure per project type. A one-off overrun is noise. A repeating pattern is a process problem.
6. On-time delivery rate
The percentage of projects or milestones delivered by their committed date. This one looks operational, but it’s a leading indicator of retention. Clients almost never churn over price. They churn over the third missed deadline in a row.
Client health KPIs: the long-game numbers
The last two are about whether the agency you’re building has a future, not just a present.
7. Client retention rate
How many of last year’s clients are still paying you this year. Most owners track churn instead. Retention tells the truer story, because it reflects the relationships you’ve actively kept warm, not just the ones that haven’t blown up yet.
Formula: (Clients at end of period − New clients added) ÷ Clients at start of period × 100
8. Client concentration risk
The share of your revenue coming from your single largest client. If that number is over 25%, you don’t really have an agency. You have a freelance contract with extra steps. Losing that client wouldn’t be a setback. It would be an extinction event.
💡 Pro Tip: The 25% rule isn’t a law of physics. Some boutique agencies run happily at 40% with a long-tenured anchor client. Just know the risk you’re carrying and price the rest of your book accordingly.
How to actually track all of this without losing your weekends
You can do this in a spreadsheet. For about three clients. After that the maths goes out of date faster than you can update it, and you start spending Sunday evenings reconciling timesheets instead of doing anything that grows the business.
That gap is the reason we built Skarya.ai. The CFO Dashboard shows signed revenue, earned revenue, cost, margin, and backlog as live numbers per client, populated automatically from approved timesheets and contract values. The eight KPIs above stop being a monthly chore and turn into something the team just sees, every day, without a separate finance ritual.
Where to start if all eight feels like too much
Pick three. Client gross margin, billable utilisation, and backlog. Those three together will tell you more about the health of your agency than any quarterly board pack ever has. Once they’re stable, the other five become useful. Not before.
Tracking KPIs for agencies isn’t really about feeling in control. It’s about being in a position where bad news arrives early enough to do something about it. That’s the only metric that actually matters.
If you’d like to see what your agency’s CFO Dashboard would look like with these numbers populated automatically, you can explore Skarya for free – no credit card, three users, every metric on this list built in.
Frequently asked questions
What’s the difference between an agency KPI and a metric?
A metric is any number you can measure. A KPI is a metric you’ve decided to act on. Page views are a metric. Client gross margin is a KPI, because if it drops below your target, something has to change. The shortlist of KPIs for agencies should always be smaller than the list of available metrics.
How many KPIs should a small agency track?
For an agency under 30 people, between five and eight is usually right. Fewer and you’ll miss early warning signs on margin or delivery. More and the team stops paying attention because no single number feels urgent. The sweet spot covers profitability, capacity, and client health without anyone needing a dashboard cheat sheet.
What’s a healthy gross margin for a digital agency?
Most healthy creative and consulting agencies aim for a gross margin around 50% to 60% at the agency level, and at least 30% per client. Below 30% on a specific client you’re working for thin air. Below 40% at the agency level you typically can’t fund growth, profit-share, or downturn buffers without taking on debt.
How often should agency KPIs be reviewed?
Profitability and capacity KPIs (gross margin, utilisation, estimate accuracy) deserve a weekly look. Client health KPIs like retention and concentration are quarterly conversations. Reviewing everything monthly sounds disciplined, but in practice it means the urgent stuff like margin slipping mid-month gets caught too late.